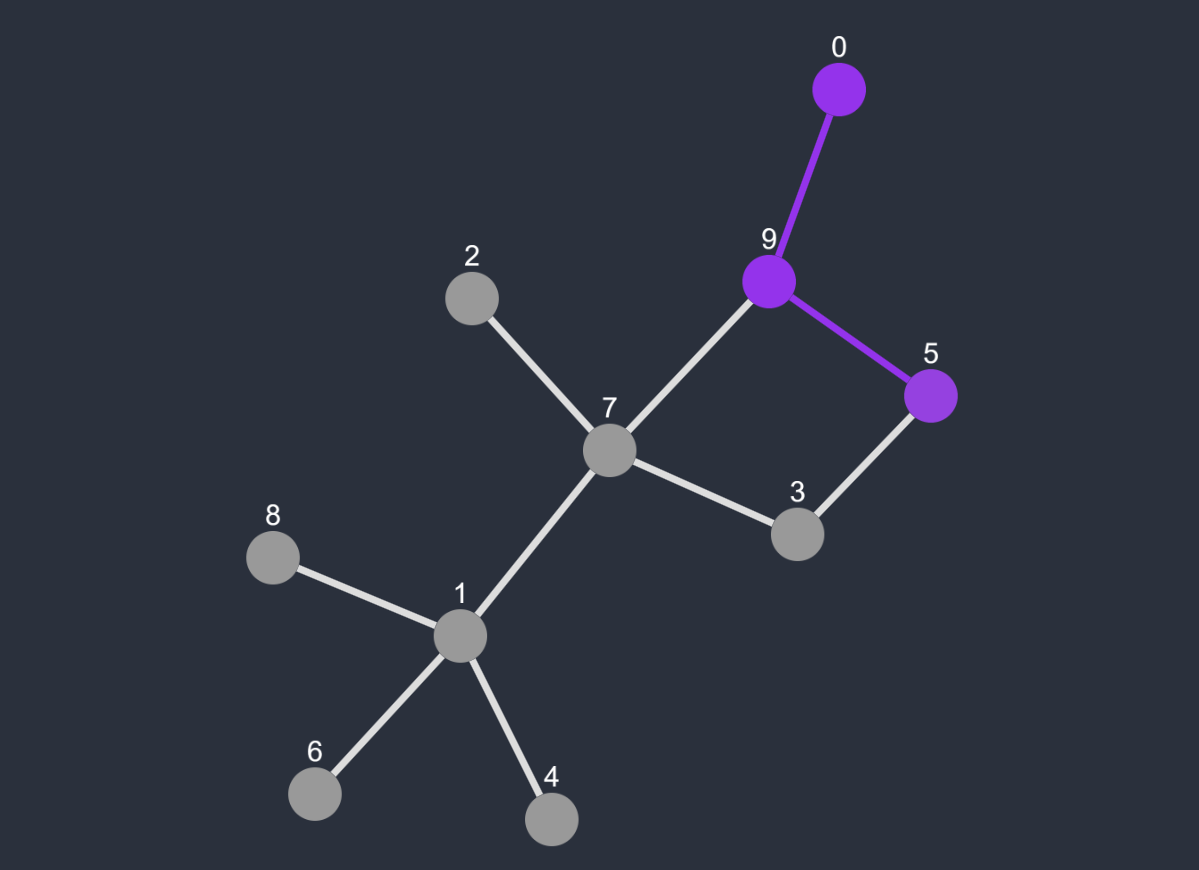
Graph Traversal Algorithm Visualizer
View on Github ~~>computer science
graphs
live demo
Description
This project is a simple visualization of two graph traversal algorithms in JavaScript:
- Breadth First Search
- Depth First Search
The visualization allows you to see the sorting algorithms in action and adjust the speed of the visualization and the number of elements to sort. The visualization is built using the CytoScape library.
Live Demo
The live demo is available to try out. It provides a simple interface to visualize the traversal algorithms in action. You can adjust the speed of the visualization and the number of elements to sort. Be sure to restart the visualization after changing the speed or number of elements.
